The Merriam-Webster Dictionary defines volatility as “a tendency to change quickly and unpredictably.” Investopedia defines volatility as “a statistical measure of the dispersion of returns for a given security or market index. In most cases, the higher the volatility, the riskier the security.”
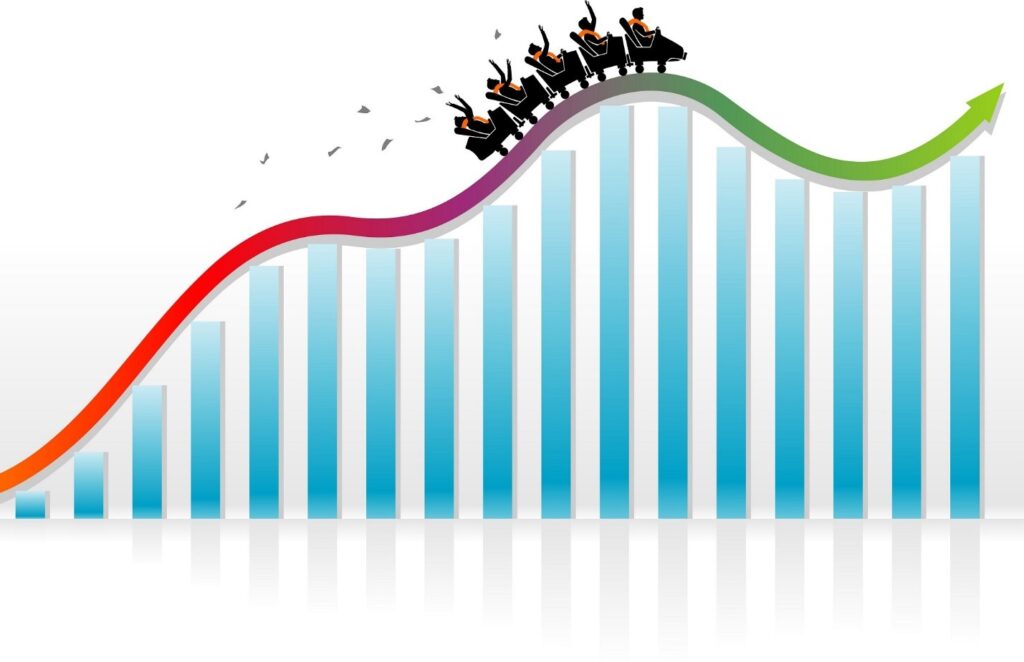
Many people think volatility is when markets or portfolio values go down. But volatility can also refer to when those go up. The market will always fluctuate, and history tells us that it can recover. For example, after the S&P 500 bottomed out in March 2020 following the “Corona Crash,” it then went up nearly 80 percent. And other than a brief downturn in September, the rise went on more or less unabated in terms of corrections.
No matter how we define it, though, volatility can be our friend — something investors can welcome instead of fearing.
With a properly managed, monitored and implemented financial plan, volatility can enhance returns, reduce income tax and ultimately provide more stability to the portfolio. This sounds counterintuitive, right? But it’s true!
Here are three ways we can benefit from volatility.
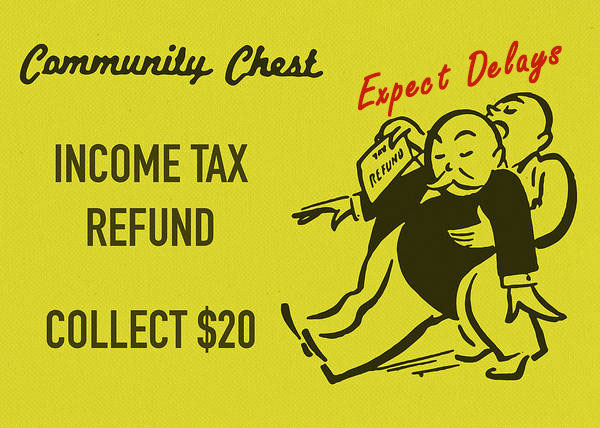
1. Consider tax swaps
Volatility with individual investments can provide the opportunity for tax swaps. A tax swap is when you sell one investment with capital losses and replace it with a similar, but not identical, investment. You can move out of an investment to try to book a tax loss while immediately reinvesting into the same underlying group of or type of investments. This can be true of either equities (stocks) or fixed income (bonds).
People who simply buy and hold bonds are missing out on the potential benefits of tax swaps. Because of volatility, a buy-and-hold strategy often results in lower returns than a strategically managed portfolio. An experienced advisor can guide you in optimizing your returns.
Does this sound illegal to you? If so, you might be thinking of a wash sale,” which is illegal. A wash sale occurs when an investor sells a security at a loss but then purchases the same or a substantially similar security within 30 days of the sale. The IRS prohibits this! You cannot sell securities at a loss so you can get a tax benefit and then buy the same stock or bond back right away. But a tax swap is legal. That means you invest in a company that’s in the same sector as the investment you sold and use many of the same trading methods.
2. Rebalance from equity to fixed income, or vice versa
Volatility also can provide you with the opportunity to rebalance from equity to fixed income, or vice versa. Although it is impossible to time markets, rebalancing is a way to buy low and sell high without actually doing so. We take a systematic approach to rebalancing, which helps you maintain an asset allocation for your financial needs, so you can achieve a better rate of return over time for any given level of risk. This can provide more stability in your portfolio.
3. Stay focused on your long-term vision
The key is to avoid trying to predict the future or time the market. When the markets go up or down, stay focused on your long-term vision and plan. Take advantage of what’s happening in the market within the context of your overall goals and plan. Ultimately, the only return that is important is the net return — the return on your investment after fees, expenses and income tax.
Our team has developed and refined our Personal Vision Planning ® process over the past 30 years for uncertain times like today. This process provides you with a customized wealth-management plan based on you and your long-term vision.
The pace of change with technology, and ultimately the markets, continues to accelerate. Our team uses cutting-edge technology to monitor and rebalance portfolios. We believe technology should not be a replacement for an experienced advisor who understands what you are trying to accomplish. Instead, technology is a tool and is just one part of the arsenal an advisor or team brings to the table.
Please contact me personally, or any member of our team, if you would like to discuss your portfolio, if you have questions or if we can otherwise be of service. As always, your vision is our priority.
________
Randy Carver, CRPC®, CDFA®, is the president and founder of Carver Financial Services, Inc., and is also a registered principal with Raymond James Financial Services, Inc. Randy has more than 32 years of experience in the financial services business. Carver Financial Services, Inc. was established in 1990 and is one of the largest independent financial services offices in the country, managing $2 billion in assets for clients globally, as of February 2021. Randy and his team, work with individuals who are in financial transition as a result of divorce, retirement, or the sale of a business. You may reach Randy at randy.carver@raymondjames.com.
________
This information does not purport to be a complete description of the securities, markets or developments referred to in this material. The information has been obtained from sources considered to be reliable, but we do not guarantee that the foregoing material is accurate or complete. Any information is not a complete summary or statement of all available data necessary for making an investment decision and does not constitute a recommendation. Any opinions are those of Randy Carver and not necessarily those of RJFS or Raymond James. Expressions of opinion are as of this date and are subject to change without notice. Links are being provided for information purposes only. Raymond James is not affiliated with and does not endorse, authorize or sponsor any of the listed websites or their respective sponsors.
Investing involves risk and you may incur a profit or loss regardless of strategy selected, including diversification and asset allocation. Raymond James and its advisors do not offer tax or legal advice. You should discuss any tax or legal matters with the appropriate professional.