If you drive past a police speed trap, you will probably slow down —not just at that moment, but also while in the near future. You will anticipate additional speed traps. That’s because of a phenomenon called recency bias, which causes us to believe recent events will dictate how the future will play out.
This concept also applies to the way we look at portfolios and markets. Because 2021 was a strong year, we tend to forget all of the corrections that have happened in the past 10 years. We focus more on recent occurrences than on those in the past.
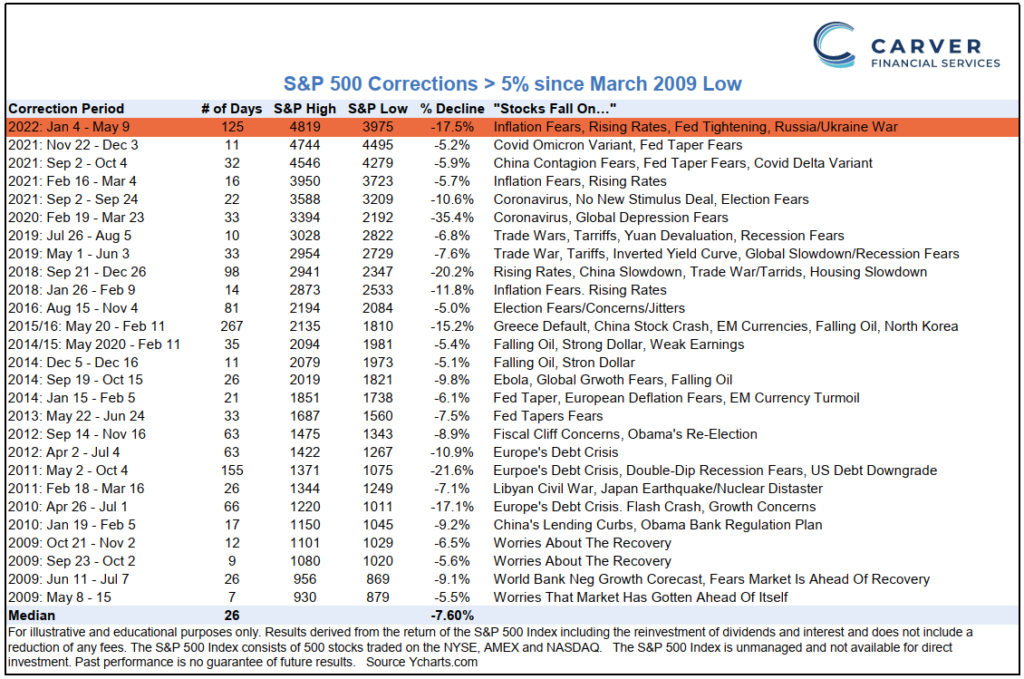
Each time there is a market correction, it feels like this time is different and almost like the world is ending. But the world keeps on turning, and, although the causes of various market corrections can differ, their characteristics and outcomes are similar. The following chart details S&P 500 corrections of more than 5 percent since March 2009.

________
As you can see, there is a myriad of reasons for past market dips, and the recent volatility is nothing new.
“Are we there yet?” That’s the question many investors keep asking while wondering if a bottom is near or if there’s more downside ahead. Here is the quick answer: nobody can answer that because markets are driven by perception in the short run. The reality is, we have had 24 corrections since 2009 and have always reached a new high. Overall corporate earnings remain strong, and although we are experiencing a lot of inflation and rising interest rates, the longer-term corporate outlook remains good.
The broader question is, does it matter? The value of a portfolio, market or index is less important than being able to meet your needs and wants today and tomorrow. While it can be worrying to see values decrease, often that provides an opportunity for tax swaps and rebalancing.
As markets become more volatile, media reporting becomes more dire, inflation rises, tax laws become more complex, and the volume of information we are exposed to increases, we are here for you. We will reach out directly for anything specific to your situation and continue to send you general information. We also continue to host events to inform, educate and inspire. Our online resources are updated with our latest thoughts and information.
We continue to monitor our clients’ portfolios and planning and proactively make updates that are consistent with your needs and objectives. We will be in touch for your regular planning meeting. As always, please reach out to us with questions or concerns. We are here for you. Your vision is our priority, and your success is our passion.
Randy Carver, CRPC®, CDFA®, is the president and founder of Carver Financial Services, Inc., and is also a registered principal with Raymond James Financial Services, Inc. Randy has more than 32 years of experience in the financial services business. Carver Financial Services, Inc. was established in 1990 and is one of the largest independent financial services offices in the country, managing $2.2 billion in assets for clients globally, as of December 2021. Randy and his team work with individuals who are in financial transition as a result of divorce, retirement or the sale of a business. You may reach Randy at randy.carver@raymondjames.com.
The information contained in this post does not purport to be a complete description of the securities, markets or developments referred to in this material. The information has been obtained from sources considered to be reliable, but we do not guarantee that the foregoing material is accurate or complete. Any information is not a complete summary or statement of all available data necessary for making an investment decision and does not constitute a recommendation. Any opinions are those of Randy Carver and not necessarily those of RJFS or Raymond James. Expressions of opinion are as of this date and are subject to change without notice.
Returns are based on the S&P 500 Total Return Index, an unmanaged, capitalization-weighted index that measures the performance of 500 large capitalization domestic stocks representing all major industries. Indices do not include fees or operating expenses and are not available for actual investment. The hypothetical performance calculations are shown for illustrative purposes only and are not meant to be representative of actual results while investing over the time periods shown. The hypothetical performance calculations are shown gross of fees. If fees were included, returns would be lower. Hypothetical performance returns reflect the reinvestment of all dividends. The hypothetical performance results have certain inherent limitations. Unlike an actual performance record, they do not reflect actual trading, liquidity constraints, fees and other costs.
Also, because the trades have not actually been executed, the results may have under- or overcompensated for the impact of certain market factors such as lack of liquidity. Simulated trading programs in general are also subject to the fact that they are designed with the benefit of hindsight. Returns will fluctuate and an investment upon redemption may be worth more or less than its original value. Past performance is not indicative of future returns. An individual cannot invest directly in an index.

 How Business Owner’s Can Reduce Liability and Increase Profits


